d3kernel-wp
中文
绕过 R3 反调试
挂上 WinDbg 双机调试加载驱动之后,发现 WinDbg 不再响应了(如图),应该是通过 KdDisableDebugger 禁用了调试器。
打开 YDArk,看到驱动注册了两个回调和一个线程。

直接调试 client,发现创建了一个 shellcode,引发除零异常以隐藏程序控制流。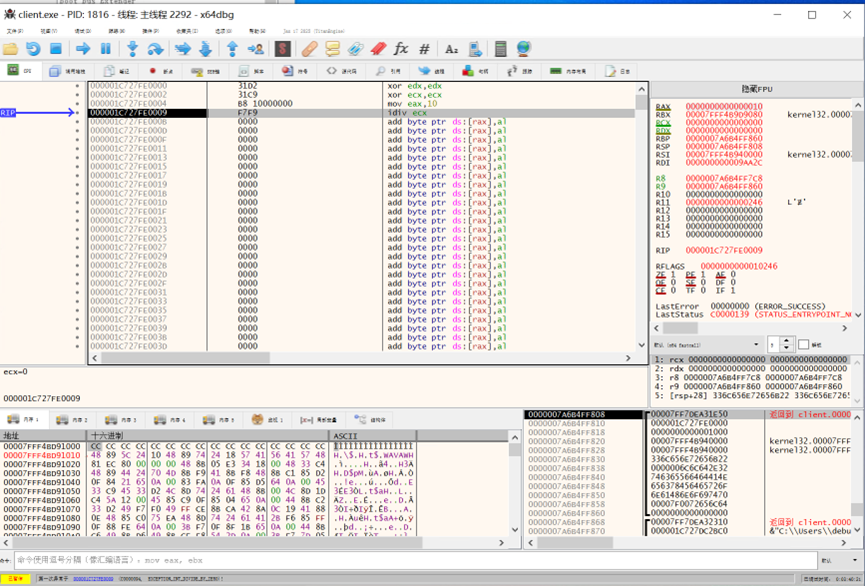
继续往下,又是一个故意的空指针异常。
题目有反调试,先对几个检测调试器的函数下断点。
都被断下了,说明程序使用了这两个函数检测调试器。
手动 patch,使这些函数直接 ret 返回。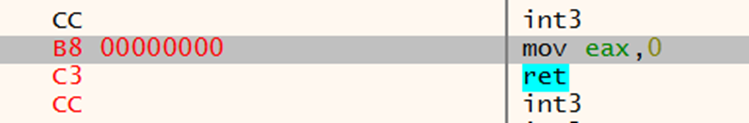
单步回到检测调试器的代码中,可以看到隐藏了导入表,函数都是动态获取的。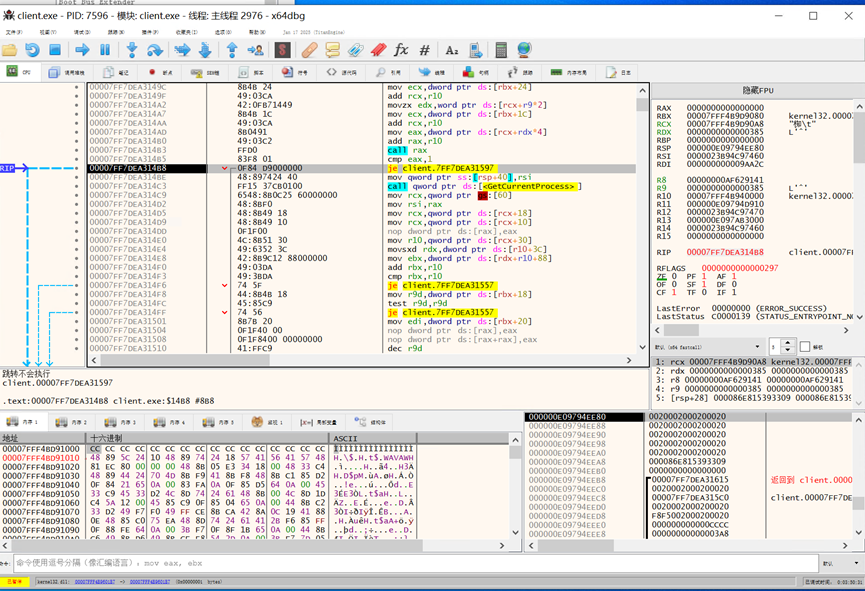
在下一个 call rax 下断点,发现确实调用了 CheckRemoteDebuggerPresent。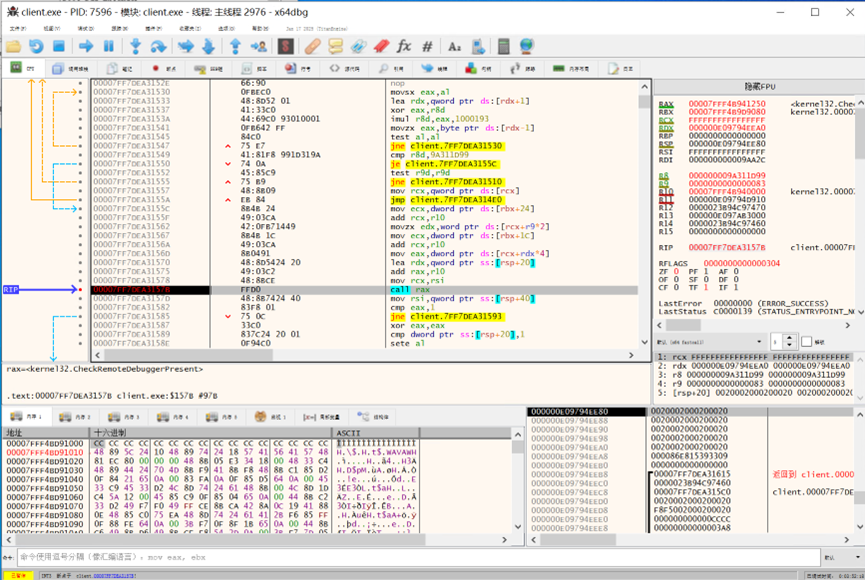
直接 patch 返回值检测(两个检测都要 patch,否则将会进入 fake_main 里)
慢慢跟到 CreateFileW。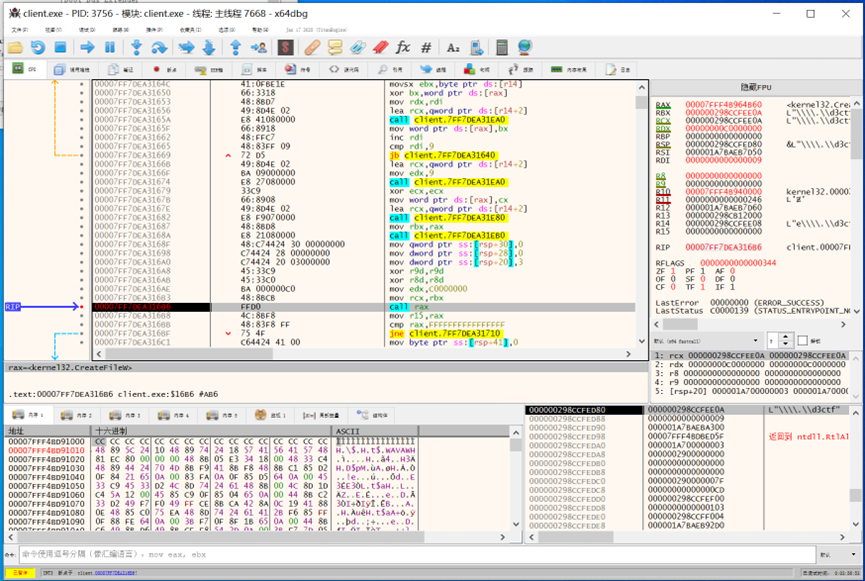
下一个 call rax 为 DeviceIoControl,发现进程是通过 DeviceIoControl 与驱动通信的。由此我们可以得知程序与驱动交互所使用的结构体等信息。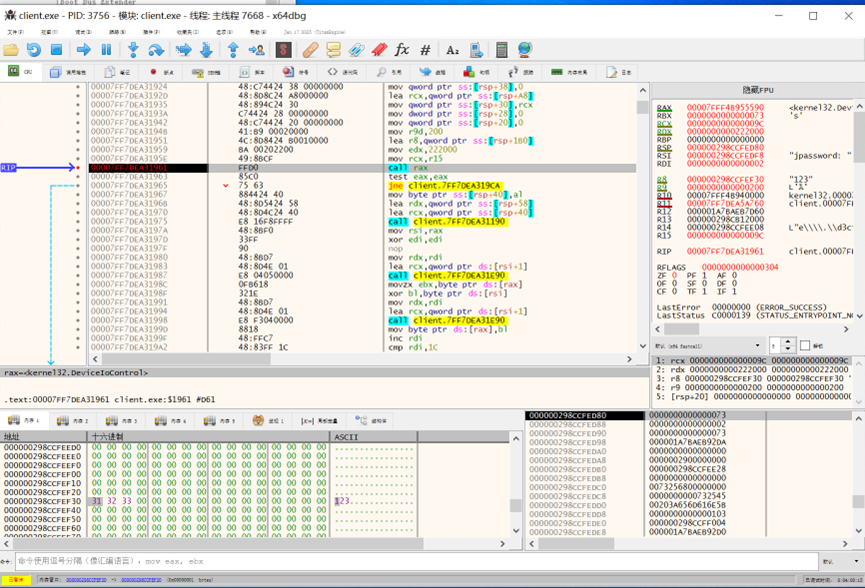
绕过 R0 反调试
当我们配置好双机调试,加载驱动后,我们发现 windbg 不再响应我们的命令,这是由于 KdDisableDebugger 关闭了双机调试,所以我们要在加载驱动之前 patch 一下 KdDisableDebugger,使它不发挥任何作用。
直接在 KdDisableDebugger 的开头 ret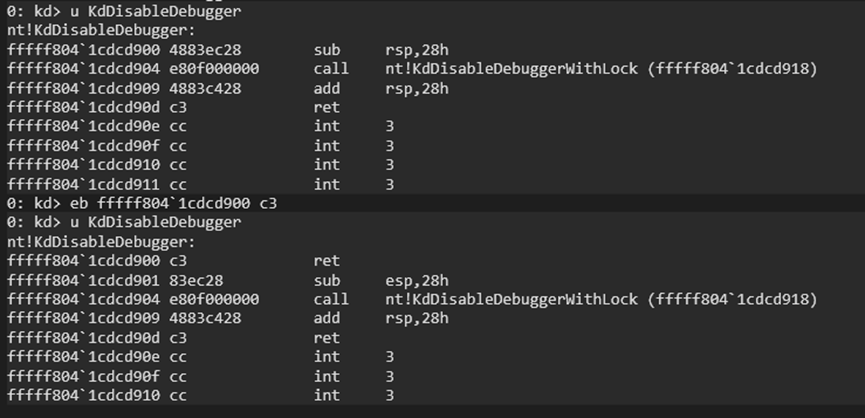
现在加载驱动就不会掉调试器了。当然你也可以以 nop 填充驱动本身创建线程处的代码,条条大路通罗马。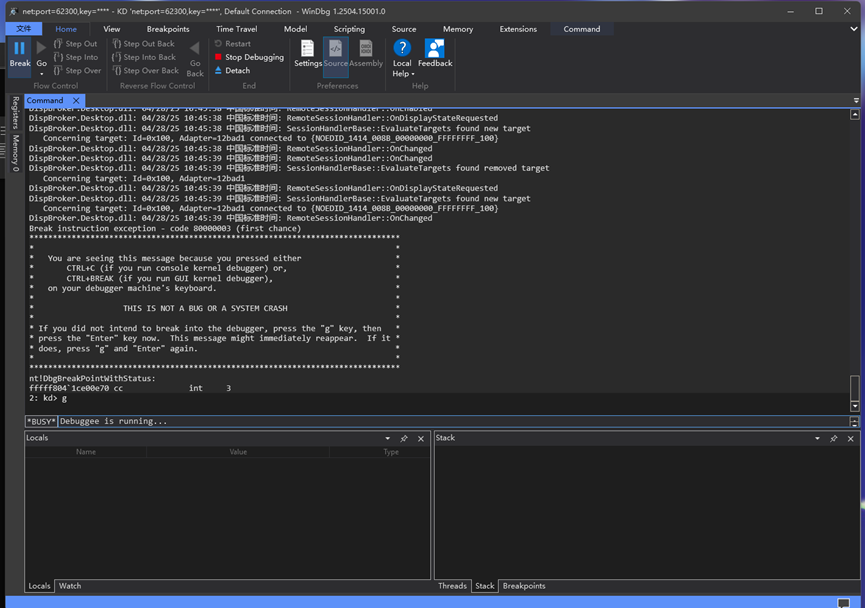
预期解:虚拟机的逆向
既然已经知道是 DeviceIoControl,那就看看 DRIVER_OBJECT 里的 MajorFunction。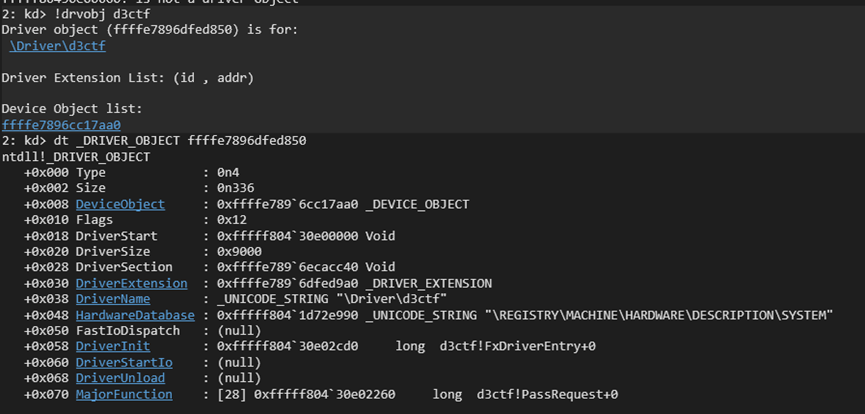
第十五个函数就是 DeviceIoControl 的处理函数了,下断点,再去用户层发请求看看。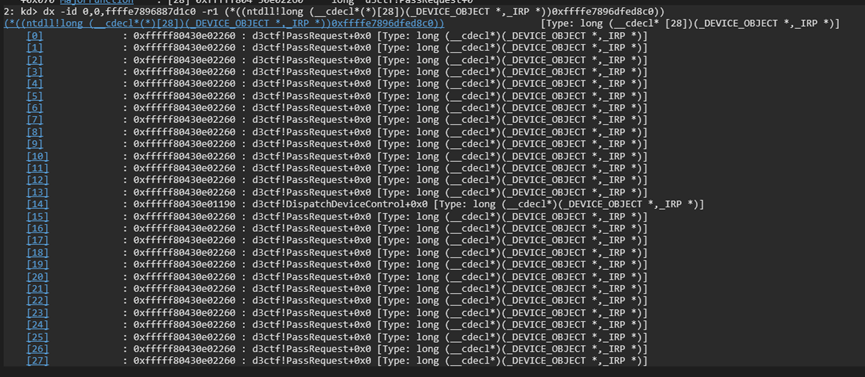
成功被断下。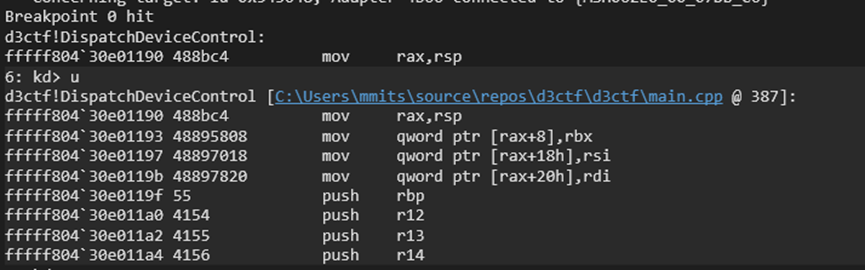
在 IDA 里可以看到这个函数超级大,inline 了一堆东西。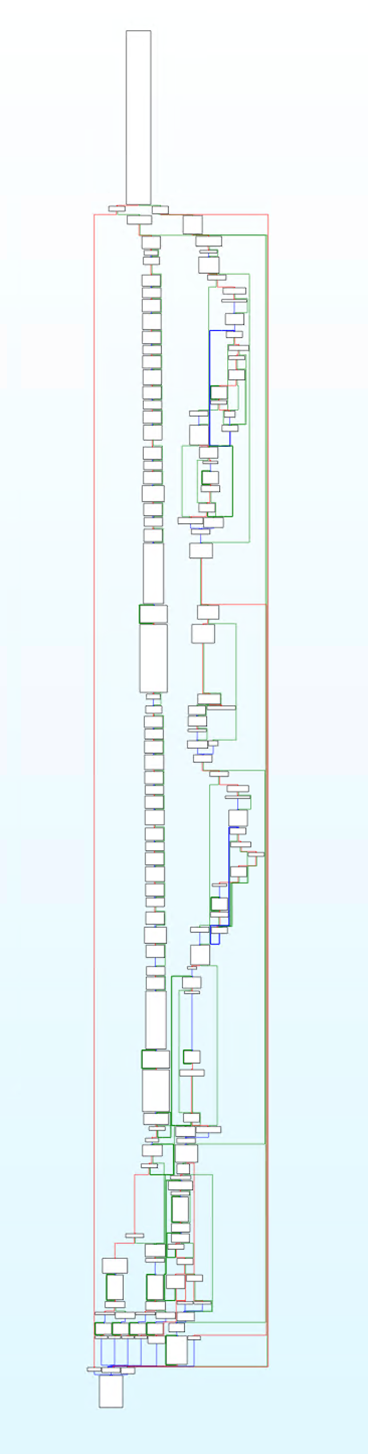
另外还发现它调用了一个看起来像虚拟机的函数。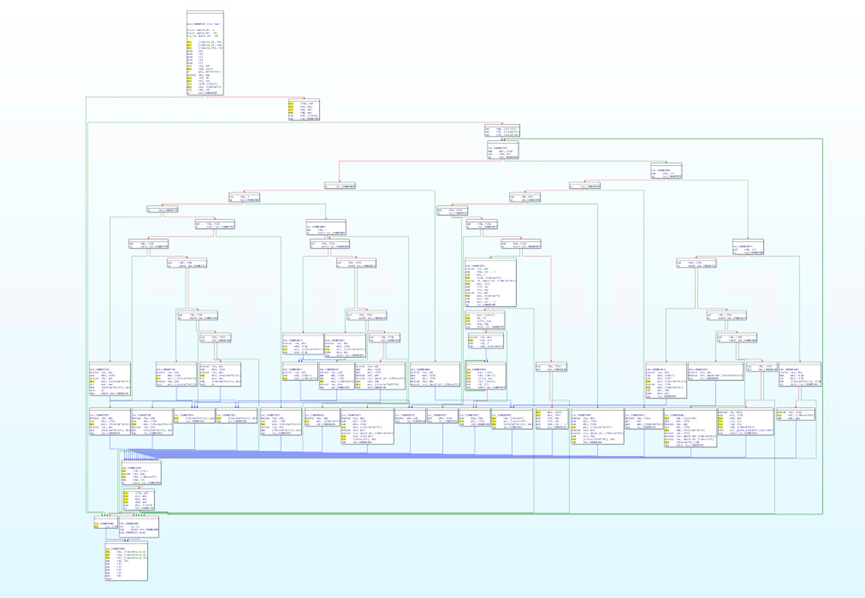
把伪代码扔给 ChatGPT 看。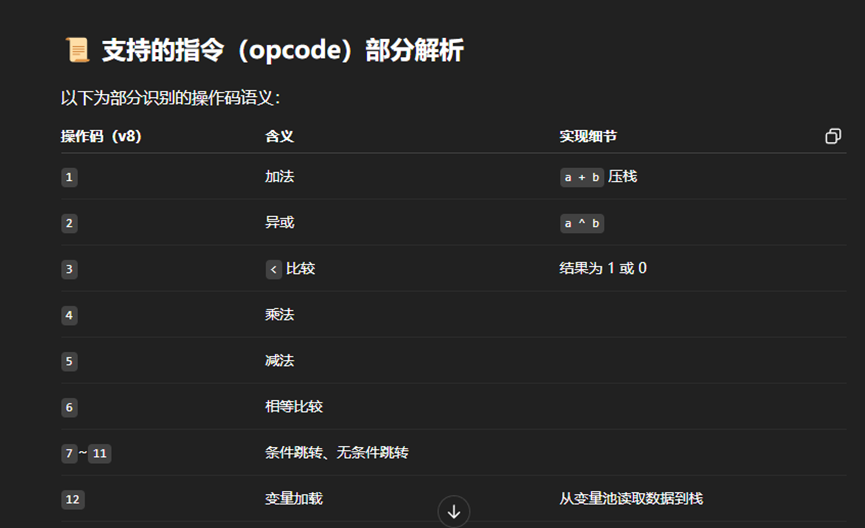
基本上都是正确的,接下来逆向虚拟机实际执行的代码,对 vm_init 下断点。
其中参数分别为虚拟机结构体,虚拟机的代码指针,虚拟机代码长度。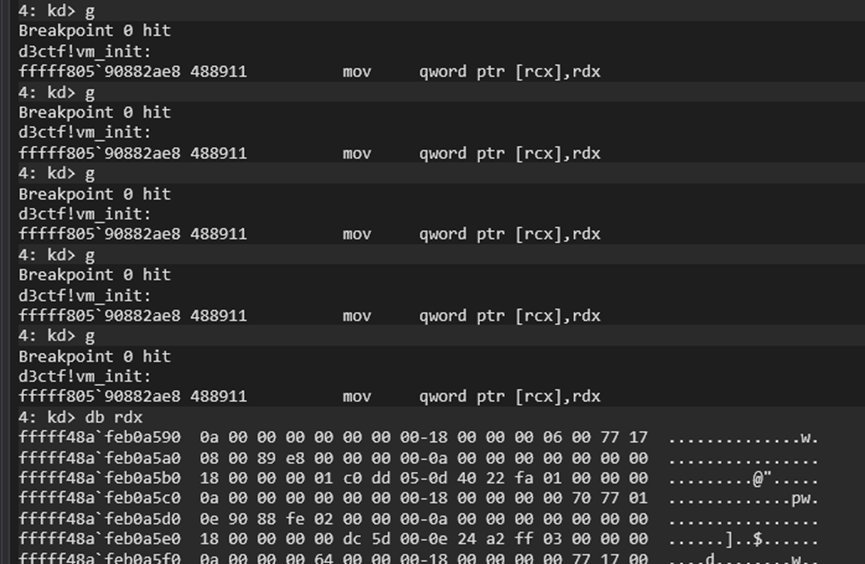
断下后寻找一个 code_size 最大的,查看虚拟机代码。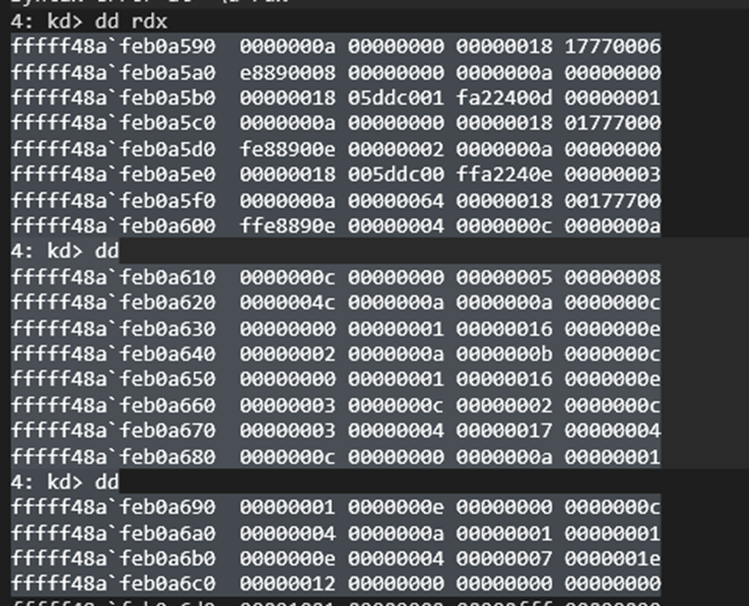
根据虚拟机代码中的定义可以得出这段虚拟机代码是将两个输入的数字异或,第一个数字为 buffer 的长度。
通过 IDA 查看到编码后的 username 和 password 为: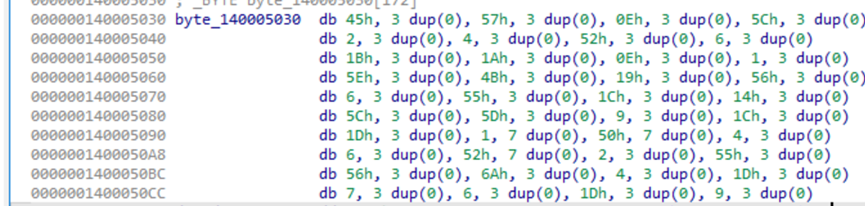
编写一个 python 脚本解密:
1 | def decrypt(buffer): |

非预期解:爆破
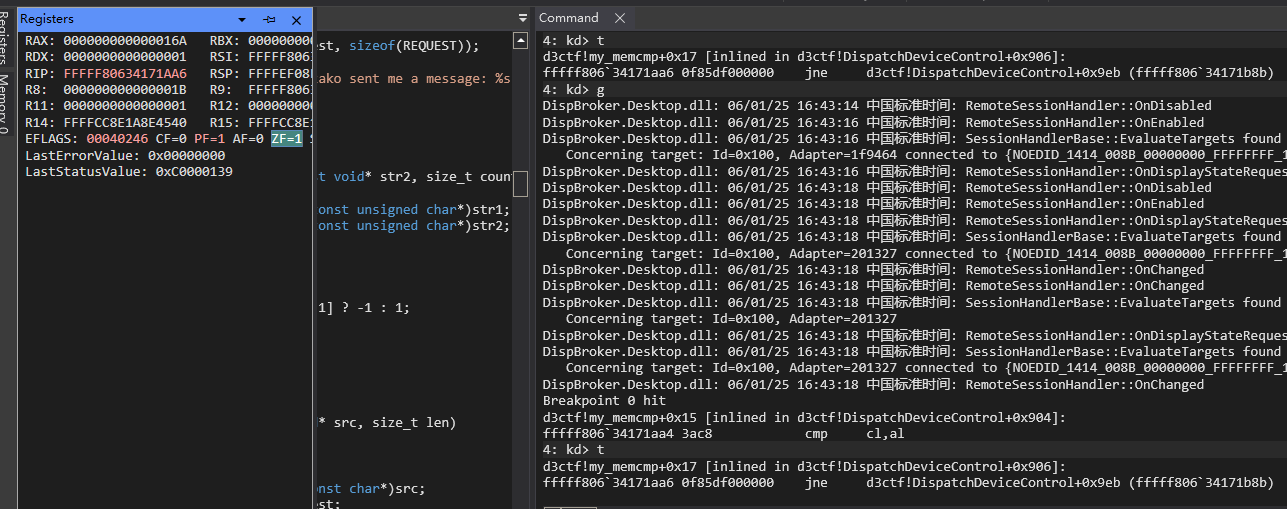
在比赛过程中,我注意到有一些选手使用了爆破的方法,这是由于这段编码较为简单,而且有很强的特征,因此我们可以在驱动验证编码后的内容是否相等的时候下断点,当我们的输入字符正确的话,我们应该可以观测到 memcmp 访问了下一个字节的数据。下面我们将会验证这个想法。
这是驱动验证编码后的内容是否相等处的代码。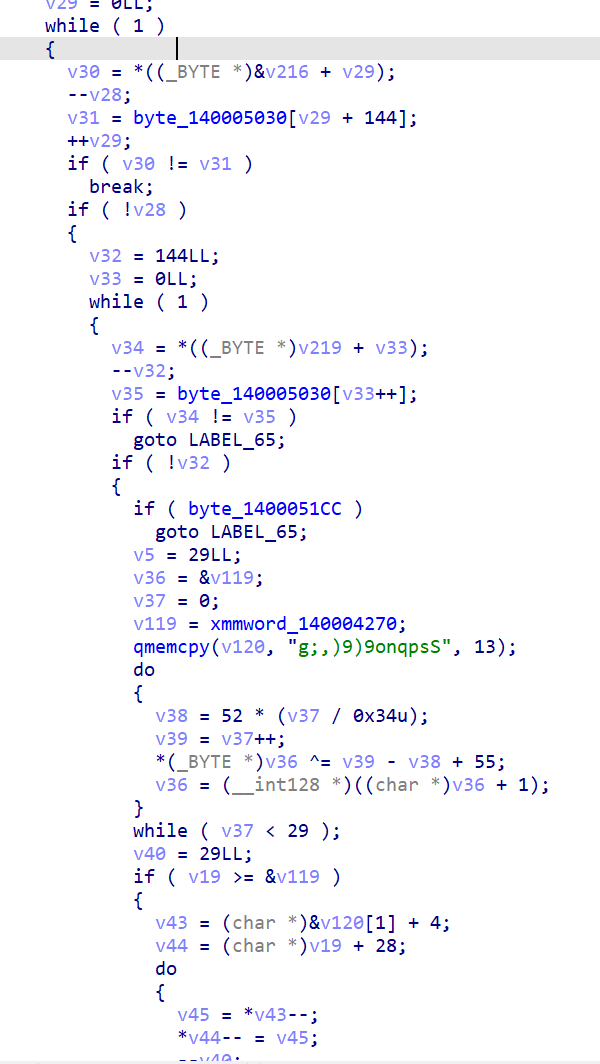
我们只要在 if ( v30 != v31 ) 处下断点,即可知道这一位是否就是正确的。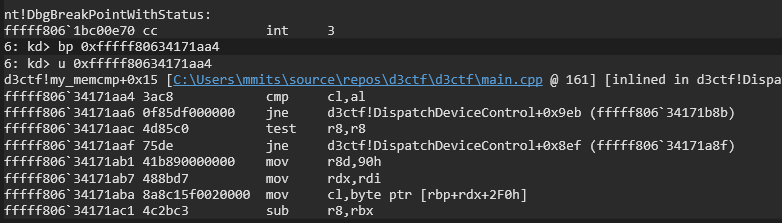
当我们输入用户名为 111111 时,跳转成立,则 1 不是用户名的第一位。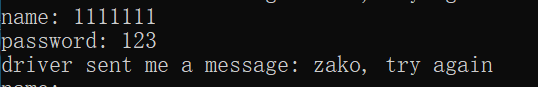

我们可以这样依次尝试,当我们输入 m111111 时,跳转不成立,则 m 是用户名的第一位。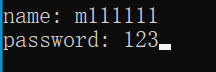
这样你只需要爆破 7 + 36 次即可得出答案!
English (Translated by ChatGPT)
Bypassing R3 Anti-Debugging
After attaching WinDbg for kernel-mode debugging and loading the driver, WinDbg stopped responding (as shown in the picture), which is likely due to KdDisableDebugger disabling the debugger.
Opening YDArk, I found that the driver registered two callbacks and a thread.
Directly debugging the client, I noticed a shellcode was created that triggers a divide-by-zero exception to hide the program’s control flow.
Continuing further, there was another deliberate null pointer exception.
The challenge includes anti-debugging mechanisms, so I set breakpoints on several debugger detection functions.
All breakpoints were hit, indicating that the program uses these two functions to detect the debugger.
I manually patched these functions to immediately ret and return.
Stepping back into the debugger detection code, I saw that the import table was hidden and all functions were dynamically retrieved.
I set a breakpoint on the next call rax and confirmed that CheckRemoteDebuggerPresent was indeed called.
I directly patched the return value check (both checks need to be patched, otherwise the program will enter fake_main).
I slowly traced the flow to CreateFileW.
The next call rax was for DeviceIoControl, and I discovered that the process communicates with the driver via DeviceIoControl. This revealed the structure used by the program to interact with the driver.
Bypassing R0 Anti-Debugging
After setting up dual-machine debugging and loading the driver, we found that Windbg stopped responding to our commands. This was because KdDisableDebugger disabled the dual-machine debugger. Therefore, we need to patch KdDisableDebugger before loading the driver to prevent it from taking effect.
Simply add a ret at the beginning of KdDisableDebugger.
Now, loading the driver won’t drop the debugger. Alternatively, you can also nop out the code where the driver itself creates a thread, as there are many ways to achieve this.
Expected Solution: Virtual Machine Reversal
Since we already know it’s using DeviceIoControl, let’s examine the MajorFunction in the DRIVER_OBJECT.
The fifteenth function is the handler for DeviceIoControl. Set a breakpoint and then send a request from the user space.
The breakpoint is successfully hit.
In IDA, you can see that this function is huge and inlined with a bunch of other code.
Additionally, I noticed it calls a function that looks like it belongs to a virtual machine.
I threw the pseudocode into ChatGPT for analysis.
It was mostly correct. Next, I reversed the actual code executed by the virtual machine and set a breakpoint at vm_init.
The parameters passed to vm_init are the virtual machine structure, the VM code pointer, and the VM code length.
After hitting the breakpoint, I searched for the largest code_size and inspected the virtual machine code.
From the definitions in the VM code, it was clear that this VM code XORs two input numbers, where the first number is the length of the buffer.
By examining the encoded username and password in IDA, I found the following:
I wrote a Python script to decrypt it:
1 | def decrypt(buffer): |
Unexpected Solution: Brute Force
During the competition, I noticed that some participants used a brute-force approach. This was due to the simplicity of the encoding and its strong characteristics. Therefore, we can set a breakpoint where the driver validates whether the encoded content is equal. When our input characters are correct, we should be able to observe memcmp accessing the next byte of data. Let’s verify this idea.
This is the code where the driver validates whether the encoded content matches.
By setting a breakpoint at if (v30 != v31), we can determine whether the current byte is correct.
When we input the username 111111, the jump occurs, meaning that 1 is not the first character of the username.
We can try this step by step. When we input m111111, the jump does not occur, so m is the first character of the username.
With this method, you only need to brute force 7 + 36 times to find the answer!